Measured Fri 14 Aug 2026, 11:57-21:00 UTC (9 market-open hours, XAUUSD)
What this is: a side-by-side comparison of six Horizon London feeds, recorded at the same time on one machine in a London data centre, and ranked by a score out of 100.
What this is not: a latency guarantee, a measure of fill quality or slippage, or a forecast. It measures price data arriving at our machine, nothing else. Past measurements do not predict future performance.
Data age: this run is from 14 Aug 2026.
1. The setup, in plain words
- One machine in a London data centre connects to all six feeds at the same time: Black, London Alpha, London Ultra, LD Beta 56, LD Gamma 19 and LD Delta 18.
- Every price update that arrives is written down with the time it arrived, using that machine's own clock. Because one clock stamps every feed, we can say which feed showed a price first without needing perfectly synchronised clocks.
- The comparison runs afterwards on those recordings. One instrument (spot gold, XAUUSD), one session: Friday 14 Aug 2026, 11:57 to 21:00 UTC, when the market was open. Black's recording started at 12:41 UTC, so every comparison that involves Black uses 12:41-21:00.
- A seventh feed was recorded but delivered almost no data in this window. It is not shown and is not part of any score or average.
Updates recorded in the window:
| Feed | Price updates | Updates that changed the price |
|---|---|---|
| Black (from 12:41) | 423,365 | 341,799 |
| London Alpha | 499,496 | 405,142 |
| London Ultra | 437,420 | 387,100 |
| LD Beta 56 | 303,082 | 274,728 |
| LD Gamma 19 | 164,731 | 146,612 |
| LD Delta 18 | 164,829 | 146,664 |
2. The score
Score = Speed (0-45) + Consistency (0-35) + Stream quality (0-20)
| Rank | Feed | Score | Speed (/45) | Consistency (/35) | Stream quality (/20) |
|---|---|---|---|---|---|
| 1 | Black | 94.8 | 45.0 | 35.0 | 14.8 |
| 2 | London Alpha | 76.4 | 35.7 | 25.5 | 15.2 |
| 3 | London Ultra | 73.2 | 35.1 | 24.9 | 13.2 |
| 4 | LD Beta 56 | 42.4 | 14.8 | 14.4 | 13.2 |
| 5 | LD Gamma 19 | 14.5 | 0.9 | 7.6 | 6.0 |
| 6 | LD Delta 18 | 6.0 | 0.0 | 0.0 | 6.0 |
Parts are rounded to one decimal so that each row adds up to its score.
London Alpha and London Ultra are close (3.2 points). With one run, we treat a gap that small as a tie.
The ranking does not depend on our weights. Scored with equal weights (each part counted the same), the order is unchanged: Black, London Alpha, London Ultra, LD Beta 56, LD Gamma 19, LD Delta 18.
How the scale works. Speed and Consistency are relative to this run: the best feed in the run gets full marks and the weakest gets 0. So LD Delta 18's score means "last of six in this run", not "6% good", and scores from different runs cannot be compared directly. Stream quality uses fixed limits, the same for every run.
3. What each part measures
Speed (0-45): how far behind the fastest feed
- In plain words: when the gold price moves, how many milliseconds later does this feed show the new price than the fastest feed?
- Why a trader cares: if you act on a slower feed, you act on an older price.
- How we measure: a price move is a change in the mid price (halfway between bid and ask), rounded to one cent. For each pair of feeds we match the same move on both, if both show it within 100 ms, and take the median difference in arrival time. Those medians place each feed on one ladder, with the fastest at 0 ms.Speed = 45 × (1 − ln(1 + ms behind) ÷ ln(1 + ms behind of the slowest feed)). The fastest feed gets 45 and the slowest gets 0. The log scale means a millisecond near the front counts for more than one near the back.
- From this run: London Alpha was a median 1.1 ms behind Black, and London Ultra 1.2 ms.
- Caveat: measured to our London machine only, including our own network path to each feed and the time our software takes to read each message.
| row first vs → | Black | Alpha | Ultra | Beta 56 | Gamma 19 | Delta 18 |
|---|---|---|---|---|---|---|
| BlackBlack | 89% | 91% | 98% | 98% | 98% | |
| London AlphaAlpha | 11% | 54% | 95% | 96% | 95% | |
| London UltraUltra | 9% | 46% | 92% | 98% | 98% | |
| LD Beta 56Beta 56 | 2% | 5% | 8% | 95% | 93% | |
| LD Gamma 19Gamma 19 | 2% | 4% | 2% | 5% | 93% | |
| LD Delta 18Delta 18 | 2% | 5% | 2% | 7% | 7% |
Measured Fri 14 Aug 2026, 11:57-21:00 UTC (9 market-open hours, XAUUSD) | one machine in a London data centre | Black recorded from 12:41 UTC
Consistency (0-35): how reliably a feed is first, against everyone
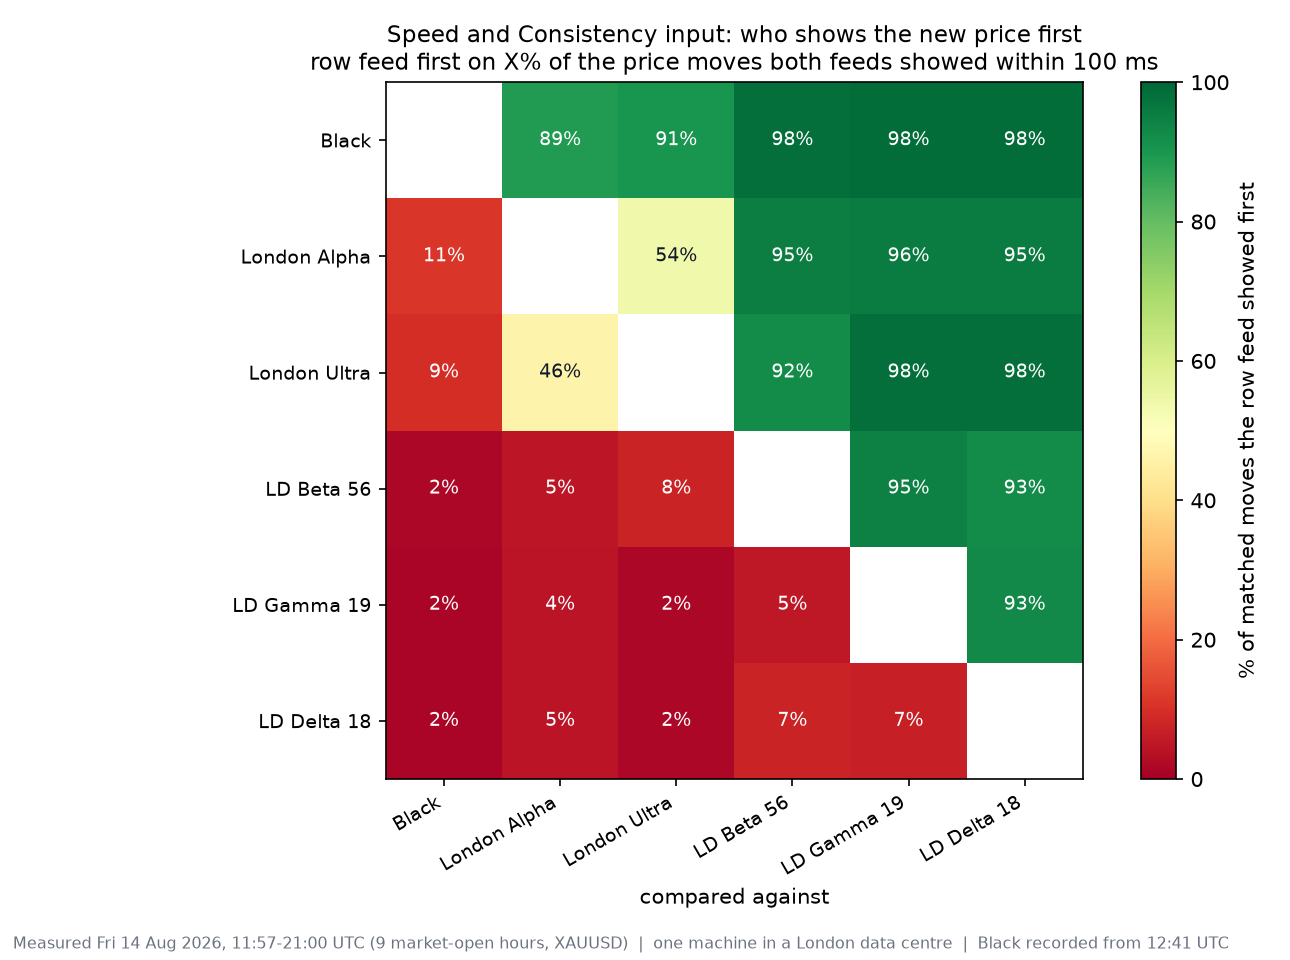
- In plain words: across all 15 head-to-head pairs, how consistently does this feed show the new price first?
- How we measure: the share of matched moves each feed showed first in every pair (the chart above), combined into one rating with the Bradley-Terry model, a standard method for ranking from pairwise contests. Pairs with more matched moves count for more. Ratings are scaled so the strongest feed gets 35 and the weakest 0.
- From this run: Black showed the new price first on 89% of moves against London Alpha, 91% against London Ultra and 98% against each of the LD feeds. London Alpha against London Ultra was close to even (54% / 46%).
- Caveat: being first is not the same as being right. A price that jumps and then reverts can still "win" a move.
Stream quality (0-20): stalls and long gaps
- In plain words: does the feed keep updating, or does it go quiet while the market moves?
- Why a trader cares: during a long gap you are looking at an old price.
- How we measure: two halves, 10 points each:
- Stalls: the share of gaps between updates longer than 500 ms. 0% scores 10 and 15% or more scores 0.
- Worst-case gap: the 99th-percentile gap between updates. 0 ms scores 10 and 2,000 ms or more scores 0.
- From this run: London Alpha's 99th-percentile gap was 695 ms with 2.0% stalls. LD Gamma 19 and LD Delta 18 were 1,484 ms with about 9.9% stalls.
Measured Fri 14 Aug 2026, 11:57-21:00 UTC (9 market-open hours, XAUUSD) | one machine in a London data centre | Black recorded from 12:41 UTC
Context charts (not part of the score)
Updates per hour show how activity changed through the session for every feed. The spread chart shows the bid-ask gap each feed displayed. In this run the spreads were near-identical across all six feeds (median $0.15 per oz), so the differences in score come from speed and gaps, not from spread.
- Black
- London Alpha
- London Ultra
- LD Beta 56
- LD Gamma 19
- LD Delta 18
LD Gamma 19 and LD Delta 18 overlap (near-identical counts).
Measured Fri 14 Aug 2026, 11:57-21:00 UTC (9 market-open hours, XAUUSD) | one machine in a London data centre | Black recorded from 12:41 UTC
The axis does not start at $0: the whole range shown is 7 cents ($0.14 to $0.21), so small gaps look larger than they are.
Measured Fri 14 Aug 2026, 11:57-21:00 UTC (9 market-open hours, XAUUSD) | one machine in a London data centre | Black recorded from 12:41 UTC
4. Wire-level cross-check (Wireshark / Npcap)
Our recordings are stamped in software, at the moment the message has been received and read. A packet capture (Wireshark with the Npcap driver) stamps the moment the packet reaches the network card. The difference between the two is our own machine and software delay; what remains is the feed's.
- When it is used: from the next run onward, a packet capture runs next to the recording for the whole session. Each result can then show how much of a feed's delay is the feed and how much is us.
- For the 14 Aug run: no packet capture was taken. The figures on this page come from software timestamps only.
- Limit: both stamps use the same machine clock, so this separates feed delay from our own delay, but it still cannot give an absolute one-way latency.
5. Limits
- One run. One Friday session (9 market-open hours) in mid-August, typically one of the quietest months of the year. Close results, such as London Alpha vs London Ultra, should be read as ties until repeated over more days.
- One symbol. XAUUSD only. Other instruments may rank differently.
- One location. Results describe delivery to one machine in a London data centre. They hold for clients near that location, not everywhere.
- No absolute latency. We can say which feed was first and by how much relative to the others, not the absolute time from the exchange to you.
- Unmatched moves are not counted. If one feed never shows a move that another shows, that move is left out of the head-to-head. Missing moves show up only through Stream quality.
- Relative scoring. Speed and Consistency are scaled within this run (best = full marks, worst = 0).
- We are the seller. Horizon sells these feeds and runs this comparison. We publish the window, the method and the counts so you can judge the results yourself.
- Data, not fills. The score measures price data arriving at our machine. It says nothing about execution prices, slippage, fills or trading results.
6. Glossary
- Update (tick): one new price message from a feed.
- Mid price: halfway between the bid and the ask.
- Spread: ask minus bid.
- Price move: a change in the mid price, rounded to one cent.
- Matched move: the same price move seen on two feeds within 100 ms.
- First / win: the feed whose update arrived at our machine earlier.
- Median / p95 / p99: the value that 50% / 95% / 99% of measurements are at or below.
- Stall: a gap of more than 500 ms between two updates of the same feed.
- Bradley-Terry rating: a standard way to turn many head-to-head results into one rating per competitor.
- Packet capture: a record of network packets, timestamped when they reach the network card.
7. Run history
| Run | Window (UTC) | Market-open hours | Symbol | Feeds shown | Notes |
|---|---|---|---|---|---|
| 1 | Fri 14 Aug 2026, 11:57-21:00 | 9 | XAUUSD | 6 | Black recorded from 12:41. Software timestamps only (no packet capture). |